1 Introductions
Important
Please check the Schedule for a list of tasks that should be completed before class today.
Welcome!
- Sit where you want… but note that we’ll move in a few minutes!
- Take out a notebook and writing utensil, but don’t unpack completely (see above).
- Meet the people around you, and check in with each other.
- ⚠️ If you haven’t done so already, please fill out the Background Survey!
Note: everything you need for class today is on the course website: https://kegrinde.github.io/STAT253/
Learning Goals
- Meet your classmates and instructor
- Understand the basic structure of this course
- Identify the appropriate task (regression, classification, unsupervised) for a given research question
- Develop foundation to be able to formulate research questions that align with regression, classification, or unsupervised learning tasks
Brief Overview of STAT 253
What’s Machine Learning?
“Machine Learning” was coined back in 1959 by Arthur Samuel, an early contributor to AI.
From Kohavi & Provost (1998): Machine Learning is the exploration & application of algorithms that can learn from existing patterns and make predictions using data.
IMPORTANT: humans are in charge of the “exploration & application”!
From James et al (2021) [link]: Statistical Learning refers to a vast set of tools for understanding data.

In STAT 253 we will…
Pick up where STAT 155 left off, acquiring tools that can be used to learn from data in greater depth and a wider variety of settings. (STAT 155 is a foundational subset of ML!)
Explore universal ML concepts using tools and software common among statisticians (hence “statistical” machine learning).
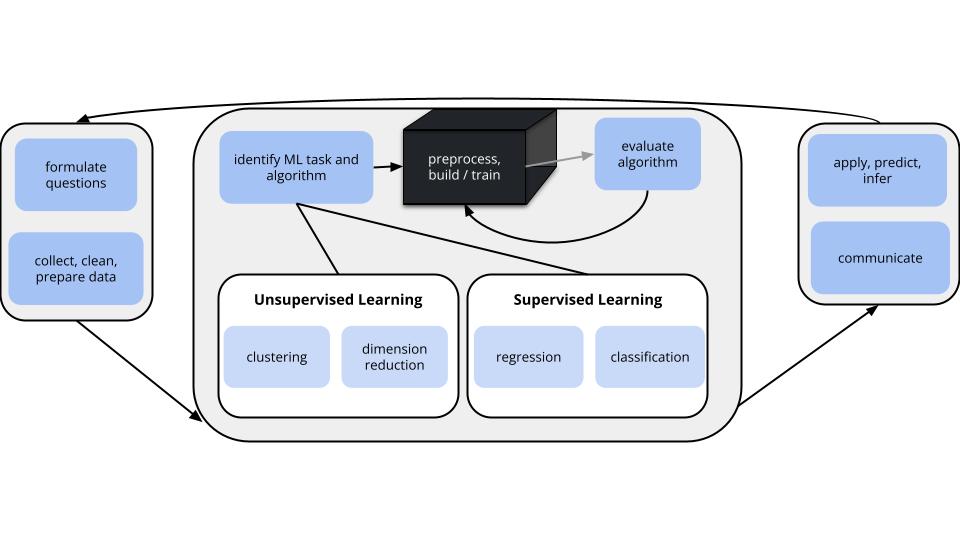
Survey a breadth of modern ML tools and algorithms that fall into the workflow below. Part of the cognitive load will be:
keeping all the tools in place (what are they and when to use them)
understanding the connections between the tools
adapting (not memorizing) code to implement each tool
a new topic almost every day
We’ll focus on concepts and applications over mathematical theory. (Come chat with me in office hours if you’re interested in learning more about the theory!)
Meet Your Classmates!
I used a machine learning algorithm, one we’ll learn later this semester, to form groups based on your responses to the pre-course informational survey. BUT it didn’t provide any explanation of why these are the groups it picked. To that end, we need humans.
- Get into your assigned group.
- Introduce yourselves in whatever way you feel appropriate (ideas: name, pronouns, how you’re feeling at the moment, things you’re looking forward to, best part of break, why you are motivated to take this class)
- Try to figure out why the algorithm put you into a group together. (I don’t personally know the answer!)
- Prepare to introduce your group to the bigger class:
- Each person will introduce themself
- One person will explain why they think the group was put together
Meet Your Instructor
A few highlights from my answers to the Background Survey…
Preferred name: “Kelsey” or “Professor Grinde”
Pronouns: she/her/hers
Hometown(s) (and walking distance!):
- Plymouth, MN (7 hr walk / 30 min drive from Mac)
- St. Paul, MN (20 min walk from Mac)
Major(s):
- BA in Math @ St. Olaf College (Northfield, MN)
- PhD in Biostatistics @ University of Washington (Seattle, WA)
About You: How have you been spending your time over break? What’s particularly important or meaningful to you? What brings you joy? What do you do when you’re not in class? What is on your mind right now?


Notes: Machine Learning Overview
Types of ML Tasks
Statistical machine learning tools can be classified as follows:
- supervised or unsupervised
- within supervised learning: regression vs classification
- within unsupervised learning: clustering vs dimension reduction
Knowing which of these scenarios your research question falls into is an important first step in identifying which tool to use!
Supervised Learning
We want to model the relationship between some output variable1 \(y\) and input variables2 \(x = (x_1, x_2,..., x_p)\):
\[ \begin{split} y & = f(x) + \varepsilon \\ & = \text{(trend in the relationship) } + \text{ (residual deviation from the trend)} \\ \end{split} \]
Types of supervised learning tasks:
regression: \(y\) is quantitative
example:
\(y\) = number of dental caries (cavities)
\(x\) = (genetic information at millions of markers, sex, age, age\(^2\), etc)
project detailsclassification: \(y\) is categorical
example:
\(y\) = whether a patient experienced adverse surgery outcomes after undergoing an upper endoscopy (yes, no)
\(x\) = (administration of sedation [anesthesia professional, nurse], age, medical comorbidities [eg sleep apnea], etc.)
project details
Unsupervised Learning
We have some input variables \(x = (x_1, x_2,..., x_p)\) but there’s no output variable \(y\). Thus the goal is to use \(x\) to understand and/or modify the structure of our data.
Types of unsupervised learning tasks:
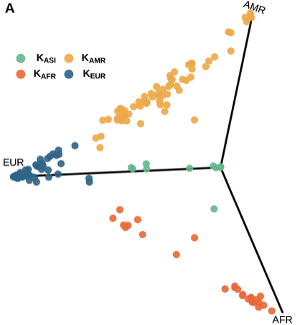
clustering: Identify and examine groups or clusters of data points that are similar with respect to their \(x_i\) values.
example:
\(x\) = (genetic data)
project details (led by a Mac alum!)dimension reduction: Turn the original set of \(p\) input variables, which are potentially correlated, into a smaller set of \(k < p\) variables which still preserve the majority of information in the originals.
example:
\(x\) = (genetic data)
project details
Exercises
Instructions
- Discuss the following scenarios as a group, talking through your ideas, questions, and reasoning as you go.
- Write down your answers, and any insights or questions that come up while working, in your notebook.
- (I’ll give you a Quarto template next time.)
- I’ll move around to groups to check in on your progress and see what questions you have.
- You can check your answers by clicking the drop-down “Solutions” button.
Questions
Indicate whether each scenario below represents a regression, classification, or clustering task.
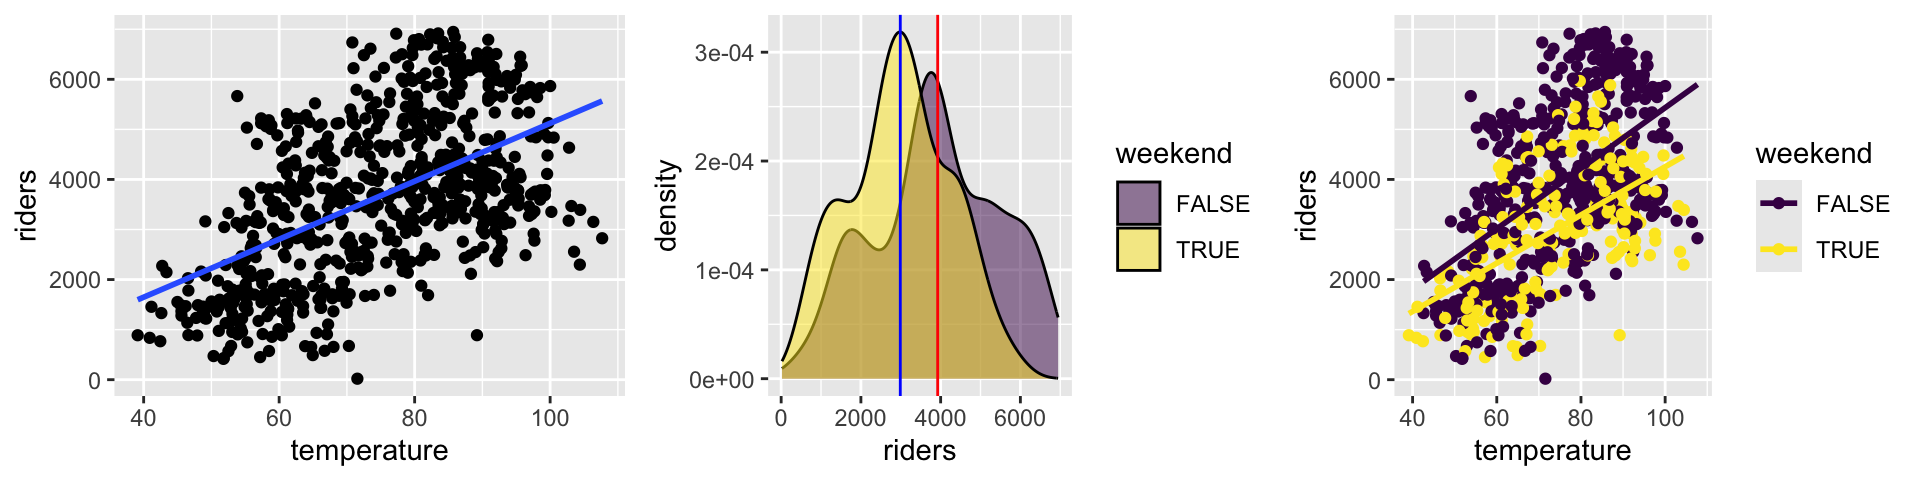
- How is the number of people that rent bikes on a given day in Washington, D.C. (\(y\)) explained by the temperature (\(x_1\)) and whether or not it’s a weekend (\(x_2\))?
Solution
regression. there’s a quantitative output variable \(y\).- Given the observed bill length (\(x_1\)) and bill depth (\(x_2\)) on a set of penguins, how many different penguin species might there be?
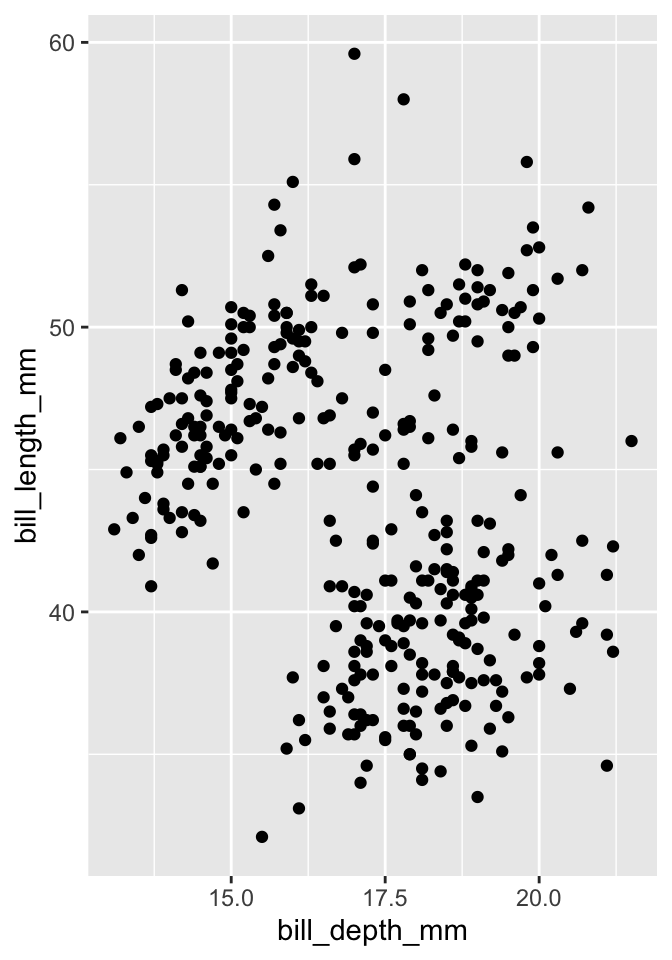
Solution
clustering. there’s no output variable \(y\).- How can we determine whether somebody has a certain infection (\(y\)) based on two different blood sample measurements, Measure A (\(x_1\)) and Measure B (\(x_2\))?
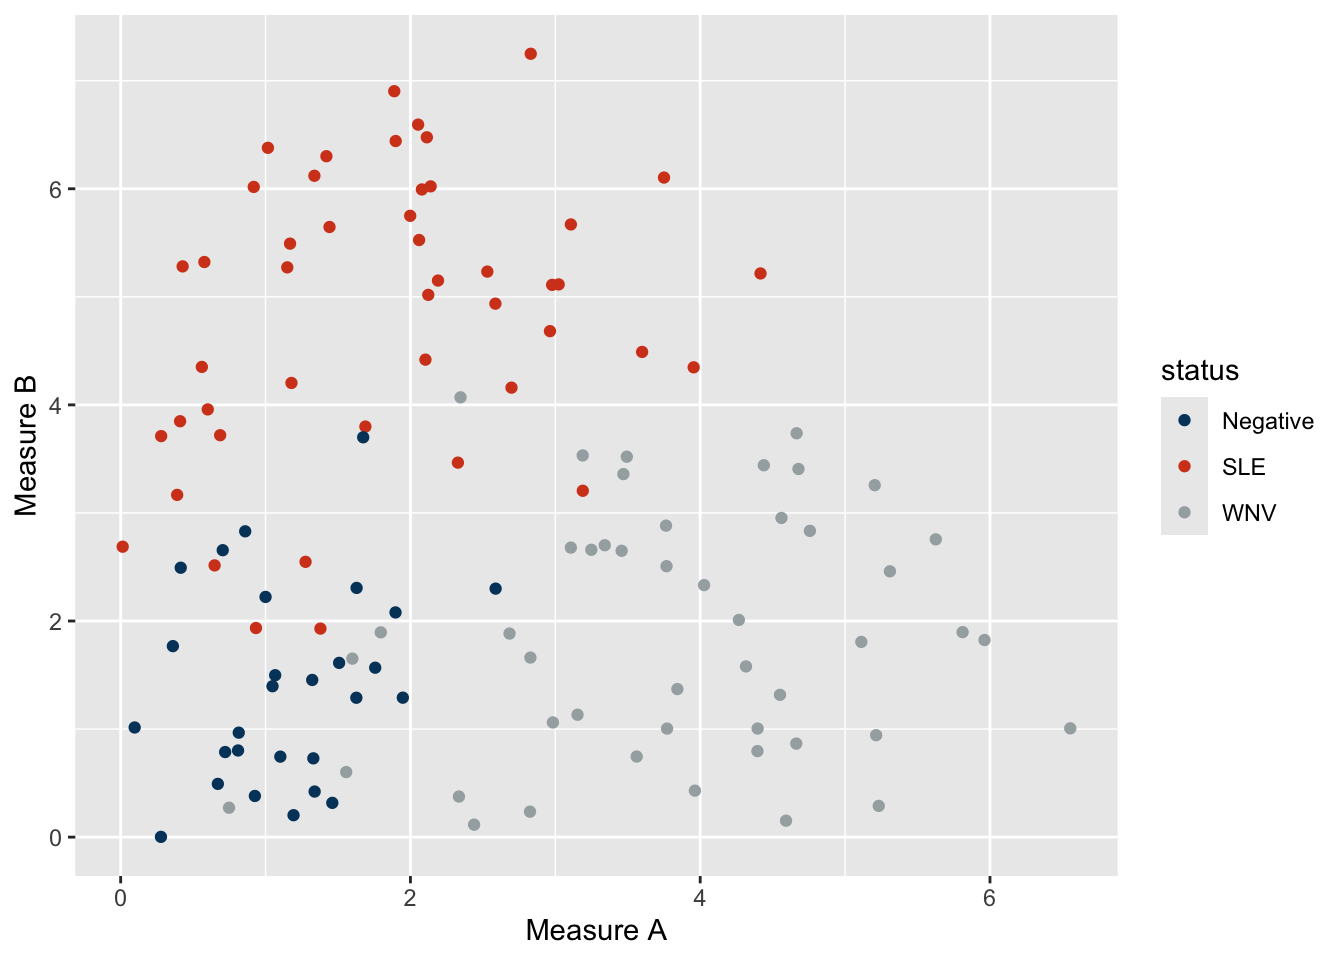
Solution
classification. there’s a categorical output variable \(y\).- Machine learn about each other! Scenario A.
I collected some data on STAT 253 students (you!) and analyzed it using a machine learning algorithm. In your groups: (1) brainstorm what research question is being investigated; (2) determine whether this is a regression, classification, or clustering task; and (3) summarize what the output tells you about your classmates.
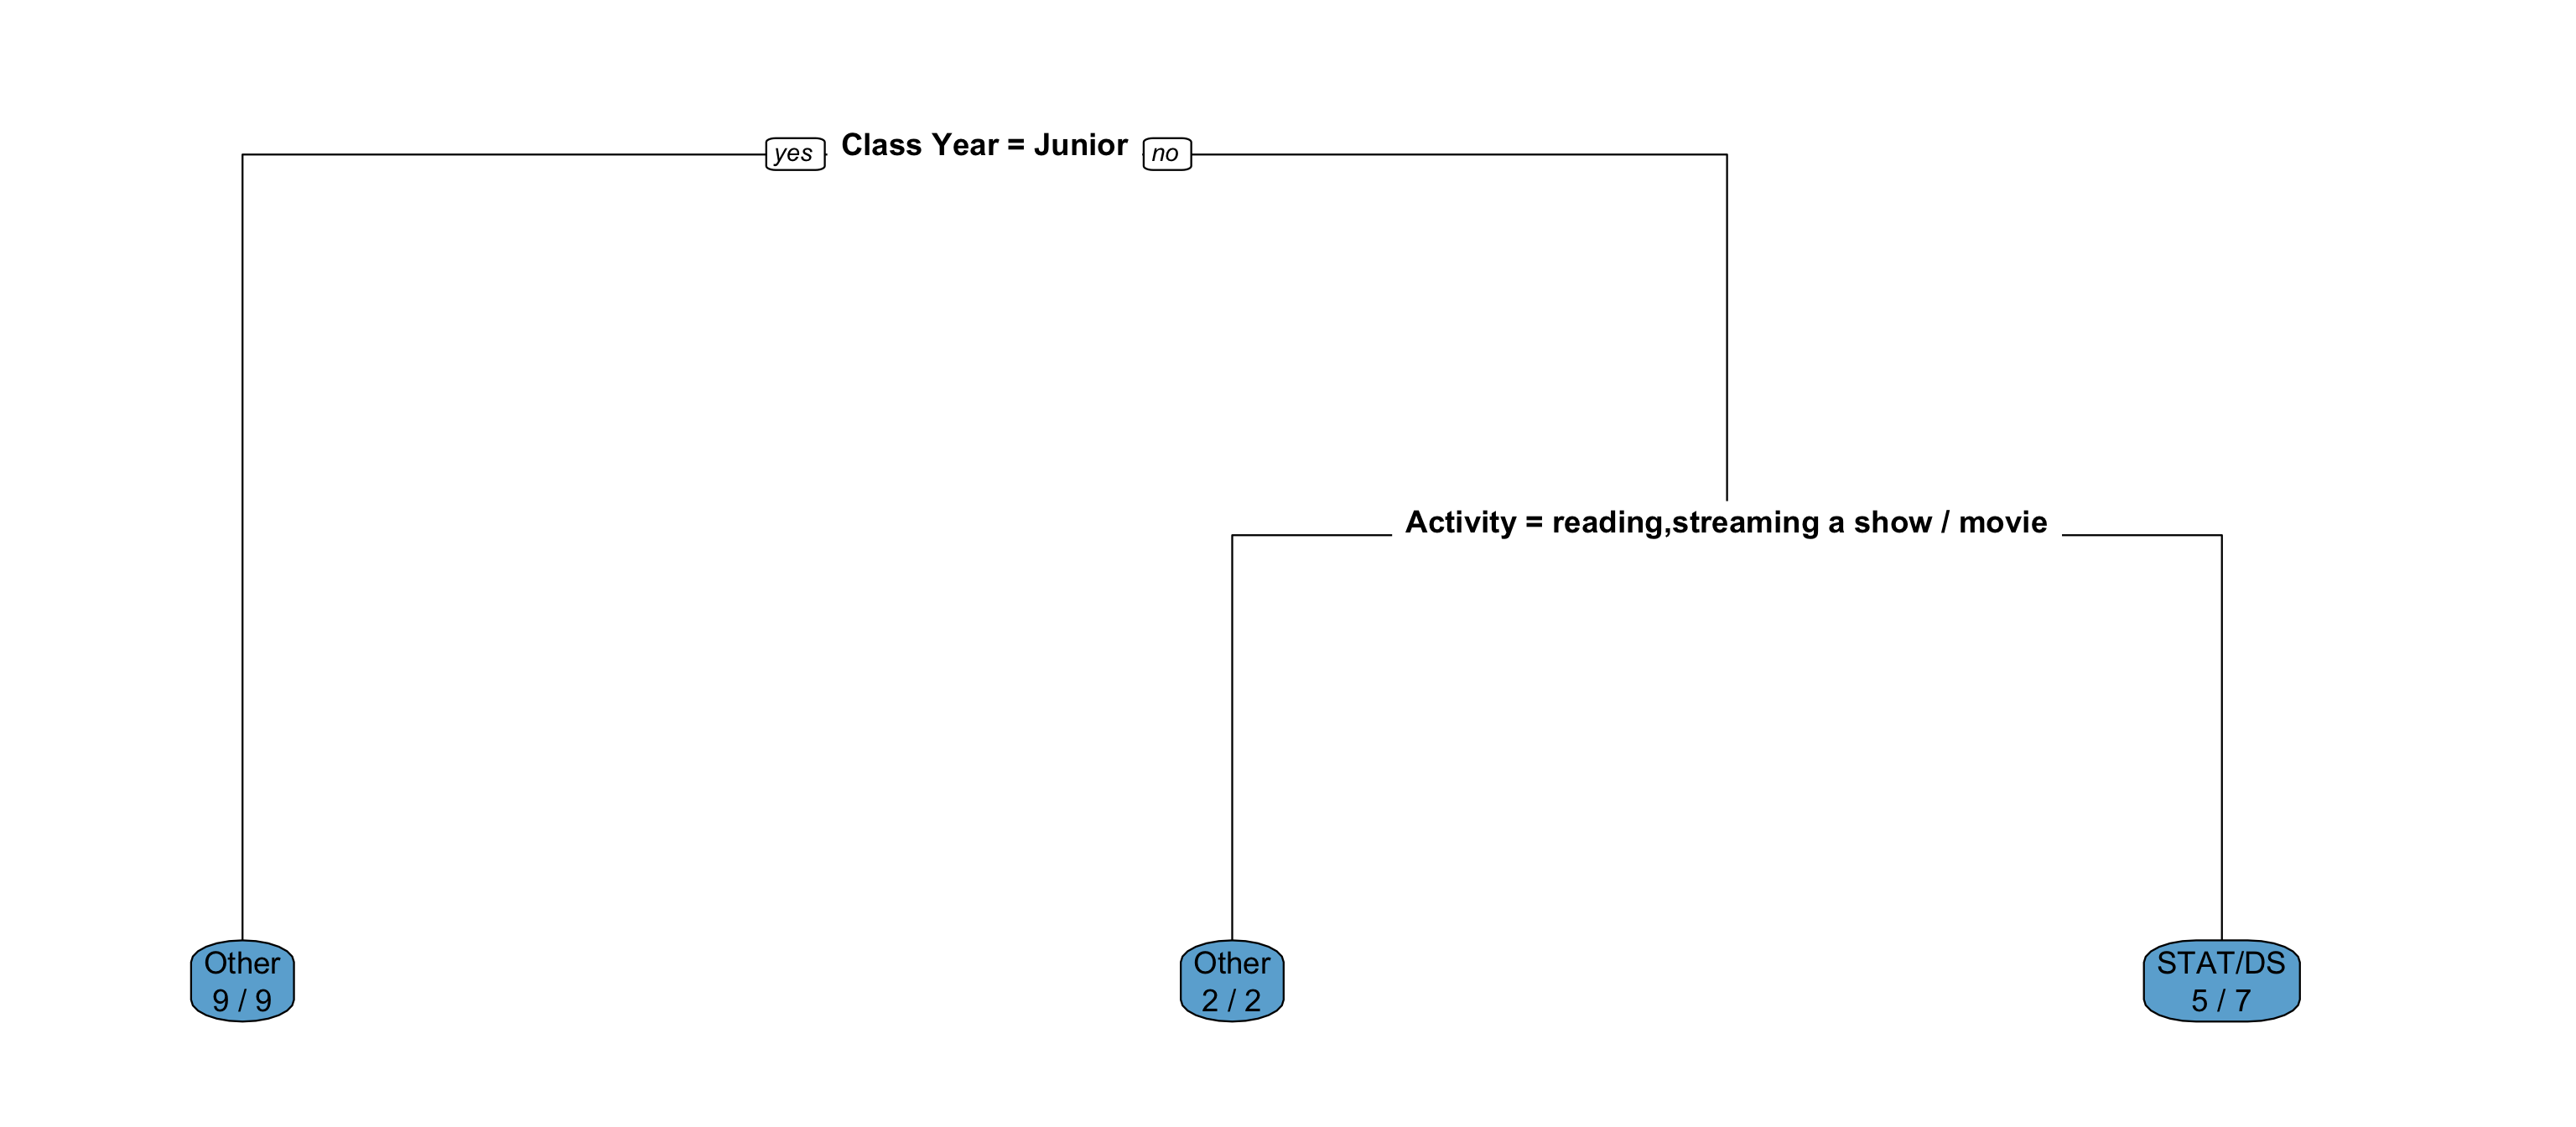
Solution
- predict someone’s major based on other survey responses
- classification (\(y\) = major is categorical)
- (will vary by semester – what do you learn about the majors represented in this class and the variables that are useful for predicting it?)
- Machine learn about each other! Scenario B.
Same directions as for Scenario A: (1) brainstorm what research question is being investigated; (2) determine whether this is a regression, classification, or clustering task; and (3) summarize what the output tells you about your classmates.
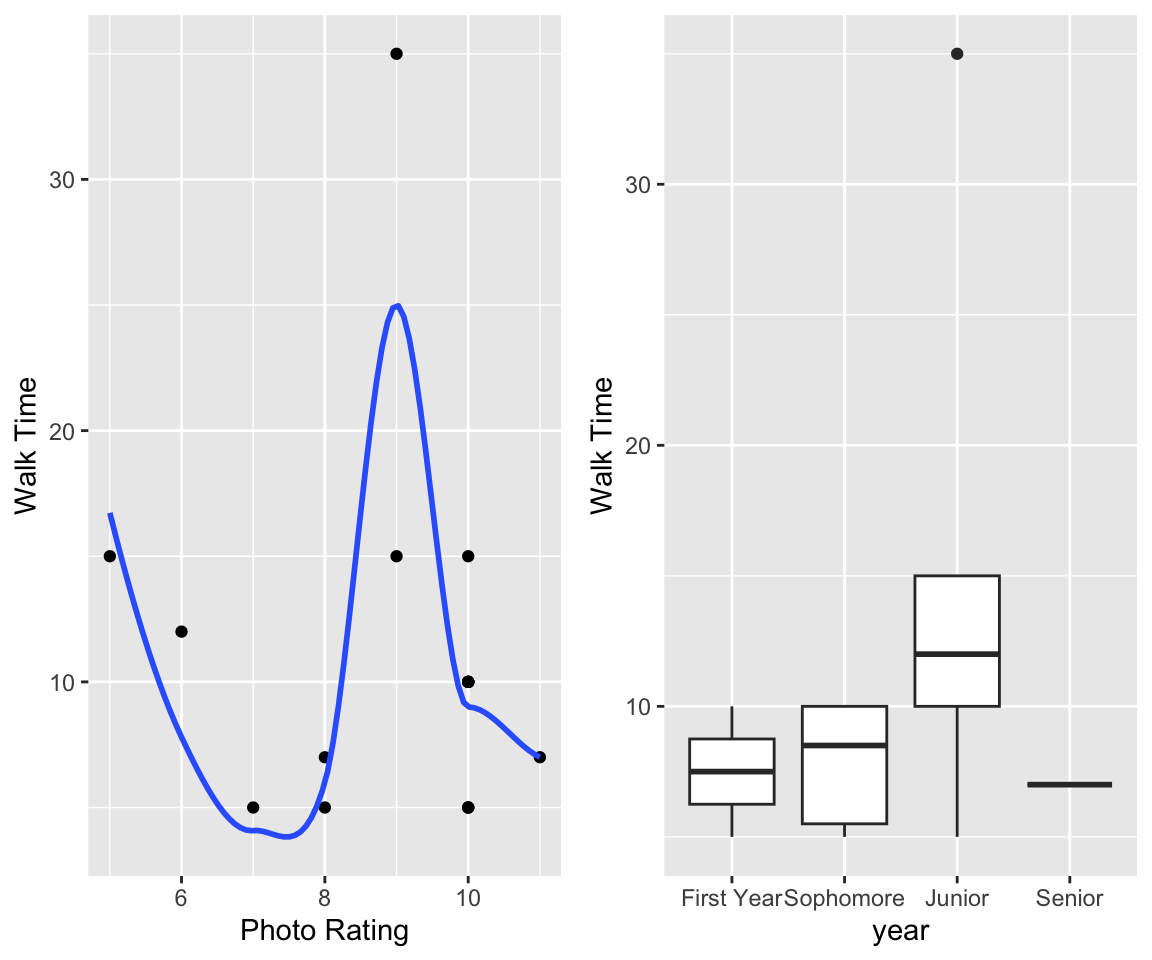
Solution
- predict walk time to Mac based on photo rating and class year
- regression (\(y\) = time to mac is quantitative)
- (answers will vary by semester – what do you learn about the relationships between these variables?)
- Machine learn about each other! Scenario C.
Same directions as for Scenario A: (1) brainstorm what research question is being investigated; (2) determine whether this is a regression, classification, or clustering task; and (3) summarize what the output tells you about your classmates.
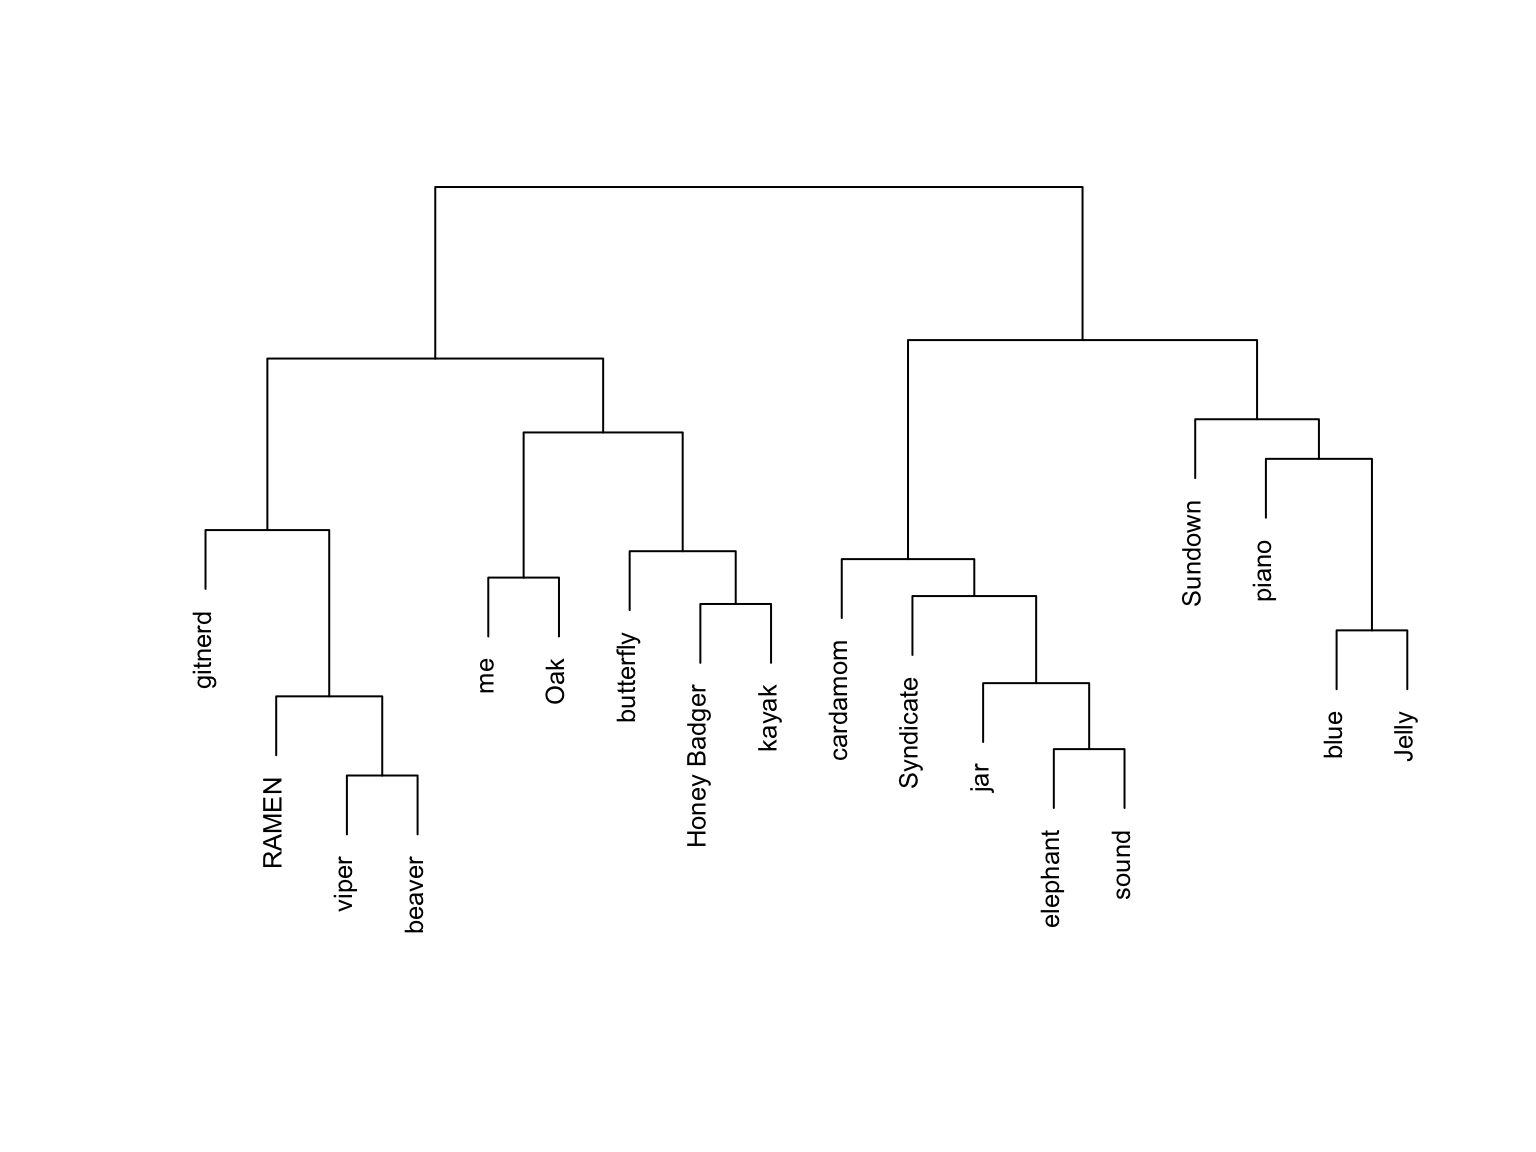
Solution
- which students in the class are most similar to which other students?
- clustering (no outcome \(y\), interested in structure/similarities across observations)
- (answers will vary by semester – to whom are you most similar? how many “natural” groupings of students do you see? etc.)
- Use Spotify users’ previous listening behavior to identify groups of similar users.
Solution
clustering
- Predict workers’ wages by their years of experience.
Solution
regression (\(y\) = wages)- Predict workers’ wages by their college major.
Solution
regression (\(y\) = wages)- Use a customer’s age to predict whether they’ve seen the Barbie movie.
Solution
classification (\(y\) = whether or not watched the film)- Look for similarities among genetic samples taken from a group of patients.
Solution
clustering (no outcome \(y\))
If you finish all of the questions above, move on to the Scavenger Hunt in the next section.
Wrapping Up
Scavenger Hunt
Working with your table, take a few minutes to find all of the following. Write down the “answers” in your notebook. Then, bookmark any important sites.
- course website
- syllabus
- textbook
- STAT 253 Slack
- office hour times and locations
- assignment deadlines
- information on what you need to complete before class each day (including your homework for next class!)
- in-class activities
- assignment instructions / submission
What’s next?
What to work on after class today:
-
- find this info on the schedule page
- review the checkpoint instructions & policies on Moodle before you start!
-
- due Friday (at 11:59 pm)
- review the Stat 155 Review resources as needed
-
- if time allows, we’ll discuss a few highlights now!
- more to come in the next few class sessions